A fast-growing baby and children’s clothing brand, supplying well-known online and wholesale retailers, asked for our help and experience to improve sales and maximise profit through the pandemic.
The business was going through a digital transformation and expanding their operation, which meant that they needed best practises and tools to help them manage their supply chain more efficiently. This would give them better insights into reducing bottlenecks and pain points and driving growth into the business.
Owing to a disjointed inventory management system, the delivery and returns information was previously inaccessible.
The ERP database and data management lacked proper documentation, which led to a failure of operational insight.
These reports were needed to provide an overview of the general health and performance of the business as well as information for the non-managerial teams.

Sample
Approach
At our kick-off meeting with the business team, we gathered their requirements and shaped initial report drafts.
Having familiarised ourselves with their ERP database and other data sources, including Google Analytics, we went on to analyse and reverse-engineer several scripts, building a picture of the system and identifying any problems. We had constant interaction with the system users, making efficient use of scheduled meetings and online communication, working remotely for social distance.
We aligned the report drafts with the data and wrote the necessary SQL queries. We then built the reports in Power BI and Excel, formatting and adding additional calculations and measures where needed.
We worked intensely on developing an MVP (Minimum Viable Product) and iterating from there.
We produced rapid cycles of writing, testing and iterating on query scripts, while also managing data cleansing.
Applying our extensive industry knowledge, we analysed and pieced together data relationships and interpreted user requirements.
The quick feedback cycles and collaborative mindset that we fostered ensured that we met the client’s deadline to complete within ten days.

Sample
Outcome
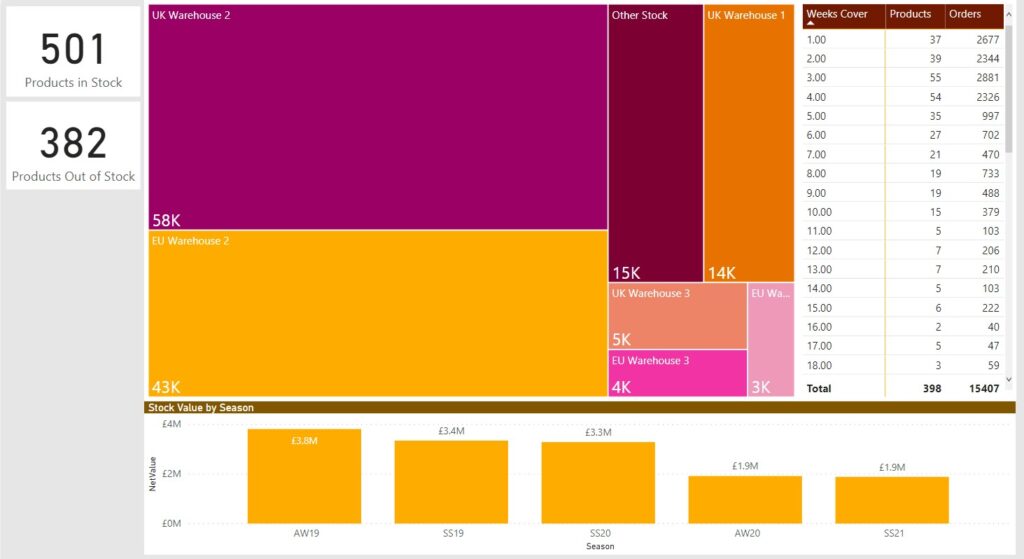
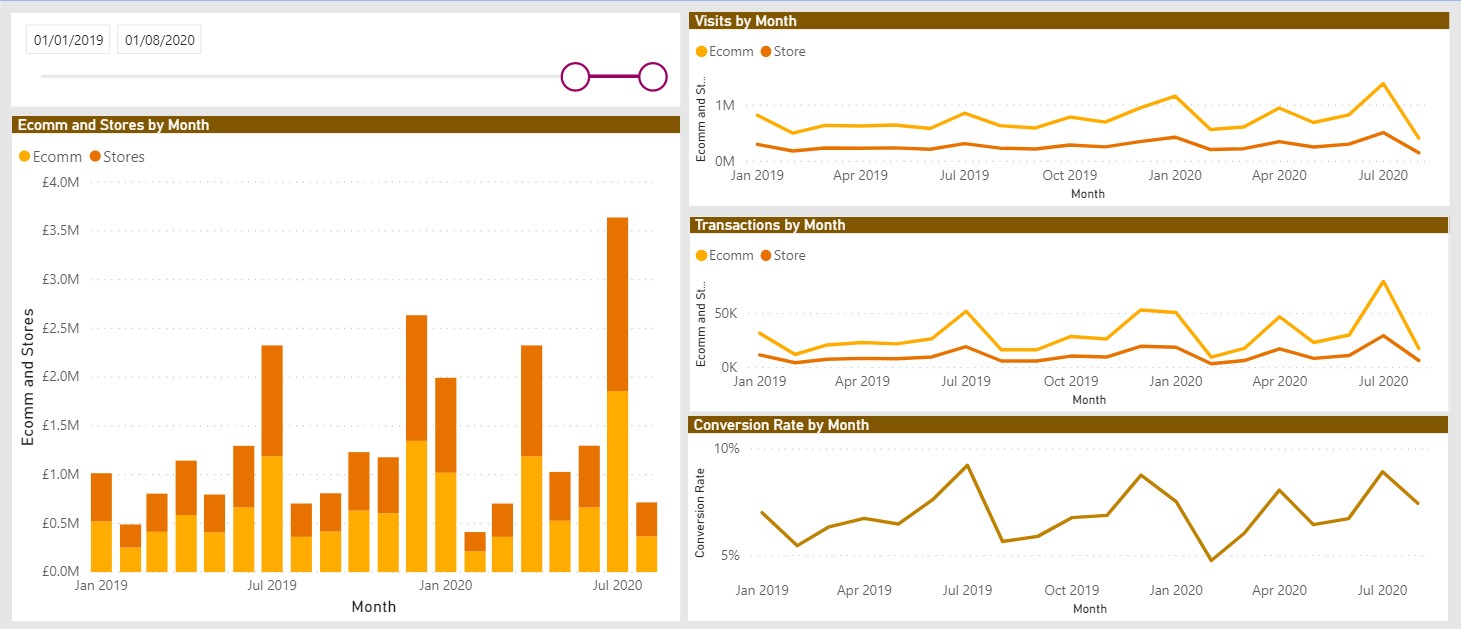
- We produced a multi-page Power BI report, providing a high-level summary of key business indicators, including turnover, margin, stock, ecommerce sales, budgets, and forecasts, with the ability to drill down on specific data. Previously this information was difficult to aggregate and poorly presented.
- We generated excel reports at Style and SKU level, detailing sales on a weekly basis, stock levels and cover, returns, delivery schedules and seasonal wholesale orders, saving several hours a week in data manipulation and formatting
- The steps we took resulted in senior stakeholders feeling more confident in operational and financial decision making and planning.
- Our implementations enabled the merchandise team to accurately manage inventory, deliveries, and promotions in a timely fashion.


